![]()
![]()
Collecting all the data is triffic... but naff all use without some means to make use of it.
The raw CAN-Bus data is recorded to the SD-Card in a CSV format producing files that look like this:
Millis,Unixtime,Lat,Long,Speed,Thing/Count,ID,Length,Data

2189997,2.195239,52.829117,-1.381941,0.000000,000471,0x3E2,8,00,8C,00,72,03,1D,01,FC,,,

2190339,2.195589,52.829117,-1.381941,0.000000,000472,0x174,8,F8,85,00,00,B8,6A,02,11,,,

2190664,2.195914,52.829117,-1.381941,0.000000,000473,0x178,8,3F,81,07,22,ED,7B,02,8A,,,

2190945,2.196183,52.829117,-1.381941,0.000000,000474,0x17C,8,00,00,00,00,DB,95,02,14,,,

2191291,2.196541,52.829117,-1.381941,0.000000,000478,0x100,6,07,F7,00,00,00,00,00,00,,,

2192930,2.198188,52.829117,-1.381941,0.000000,000481,0x174,8,CE,85,00,00,3F,6A,03,43,,,
That's not a whole lot of use unless you're going to manually work out that the 0x100 packet is for the RPM and the first two data bytes (07 and F7) should be combined and converted into decimal to give you 2,039 RPM. The RPM CAN-Bus packet is simple; the others get a lot more complicated.
So the Data Logger's got an inbuilt export feature that converts the raw CAN-Bus data into a more friendly format that outputs a line for each GPS position. You end up with a file that looks like this:
UTCTimestamp,Latitude,Longitude,Speed:kph,RPM:int,Gear:int,Grip:percent,TPS:percent,LeanAngle:deg,WheelieAngle:deg,FW_Speed:kph,RW_Speed:kph,KTRC_Working:int,AntiWheelie_Working:int,Water_Temp:float,Intake_Temp:float,KTRC_Active_Mode:int,KTRC_Setting_Level:int,Wheelie_Mode:int,Wheelie_Setting:int,

1553340586.900861,52.829117,-1.381930,1.601000,1847,0,-0.32, 1.96,-4.10, 0.00, 3.16, 2.86,0,0,88.00,16.00,1,0,2,0

1553340586.997741,52.829105,-1.381930,1.410000,1882,0,-0.32, 1.96,-3.91, 0.00, 3.16, 2.82,0,0,88.00,16.00,1,0,2,0

1553340587.596818,52.829105,-1.381919,2.244000,1968,0,-0.32, 1.96,-4.10, 0.00, 2.95, 2.69,0,0,88.00,16.00,1,0,2,0

1553340590.800801,52.829094,-1.381919,0.302000,1890,0,-0.45, 1.84, 1.95, 0.00, 0.00, 0.00,0,0,86.00,16.00,1,0,2,0
Perhaps showing it in a tabular form illustrates it better
UTCTimestamp Latitude Longitude Speed:kph RPM:int Gear:int Grip:percent TPS:percent LeanAngle:deg WheelieAngle:deg FW_Speed:kph RW_Speed:kph KTRC_Working:int AntiWheelie_Working:int Water_Temp:float Intake_Temp:float KTRC_Active_Mode:int KTRC_Setting_Level:int Wheelie_Mode:int Wheelie_Setting:int 1553340586.900861 52.829117 -1.381930 1.601000 1847 1 -0.32 1.96 -4.10 0.00 3.16 2.86 0 0 88.00 16.00 1 0 2 0 1553340586.997741 52.829105 -1.381930 1.410000 1882 1 -0.32 1.96 -3.91 0.00 3.16 2.82 0 0 88.00 16.00 1 0 2 0 1553340587.596818 52.829105 -1.381919 2.244000 1968 1 -0.32 1.96 -4.10 0.00 2.95 2.69 0 0 88.00 16.00 1 0 2 0 1553340590.800801 52.829094 -1.381919 0.302000 1890 1 -0.45 1.84 1.95 0.00 0.00 0.00 0 0 86.00 16.00 1 0 2 0
Each column heading describes what's being shown and the unit of measure. So "RPM:int" means it the bike's current RPM and the values are integers. The "TPS:percent" column shows the Throttle Position Sensor as a percentage (this is the throttle controlled by the ECU - the Grip column shows how much you're twisting the 'throttle' on the handlebars.
You can pull this CSV into your favorite spreadsheet program and play with it to your heart's content. Tip: you can paste the Lat/Long figures into Google Maps to see exactly where the data point was recorded; just seperate the lat/long numbers with a comma.
In order to keep the size of file manageable for analysis, the export function only outputs a 'Log Point' each time the GPS position changes and the RPM value is greater than zero; in other words when the bike is moving under it's own power. The Logger builds up the CAN-Bus received between each Log Point and outputs the summation.
While looking at the data in a spreadsheet can be interesting, the aim (pun almost intended) has got to be displaying the datapoints in a graphical format together with the position on a circuit map.
The best known, in race bike circles, Data Logger is probably AiM but although their Race Studio software is free to download, they intentionally do not publish their input data format so unless someone has reverse engineered it, that's a dead end.
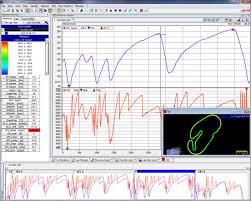
There are other very similar products and some are more open with their data formats and I'm working with Tom of Serious Racing to add the data logger information to his impressive lap displays. I like Serious-Racing as it's been done by an enthusiast and is provided FOC - just like my logger :)
Update April '19: The Logger can now produce log files in the VBO format for use in Racelogic's Circuit Tools. Initially I didn't like Circuit Tools that much but it's grown on me as I've played with it and some features are nicer than AIM's Race Studio.
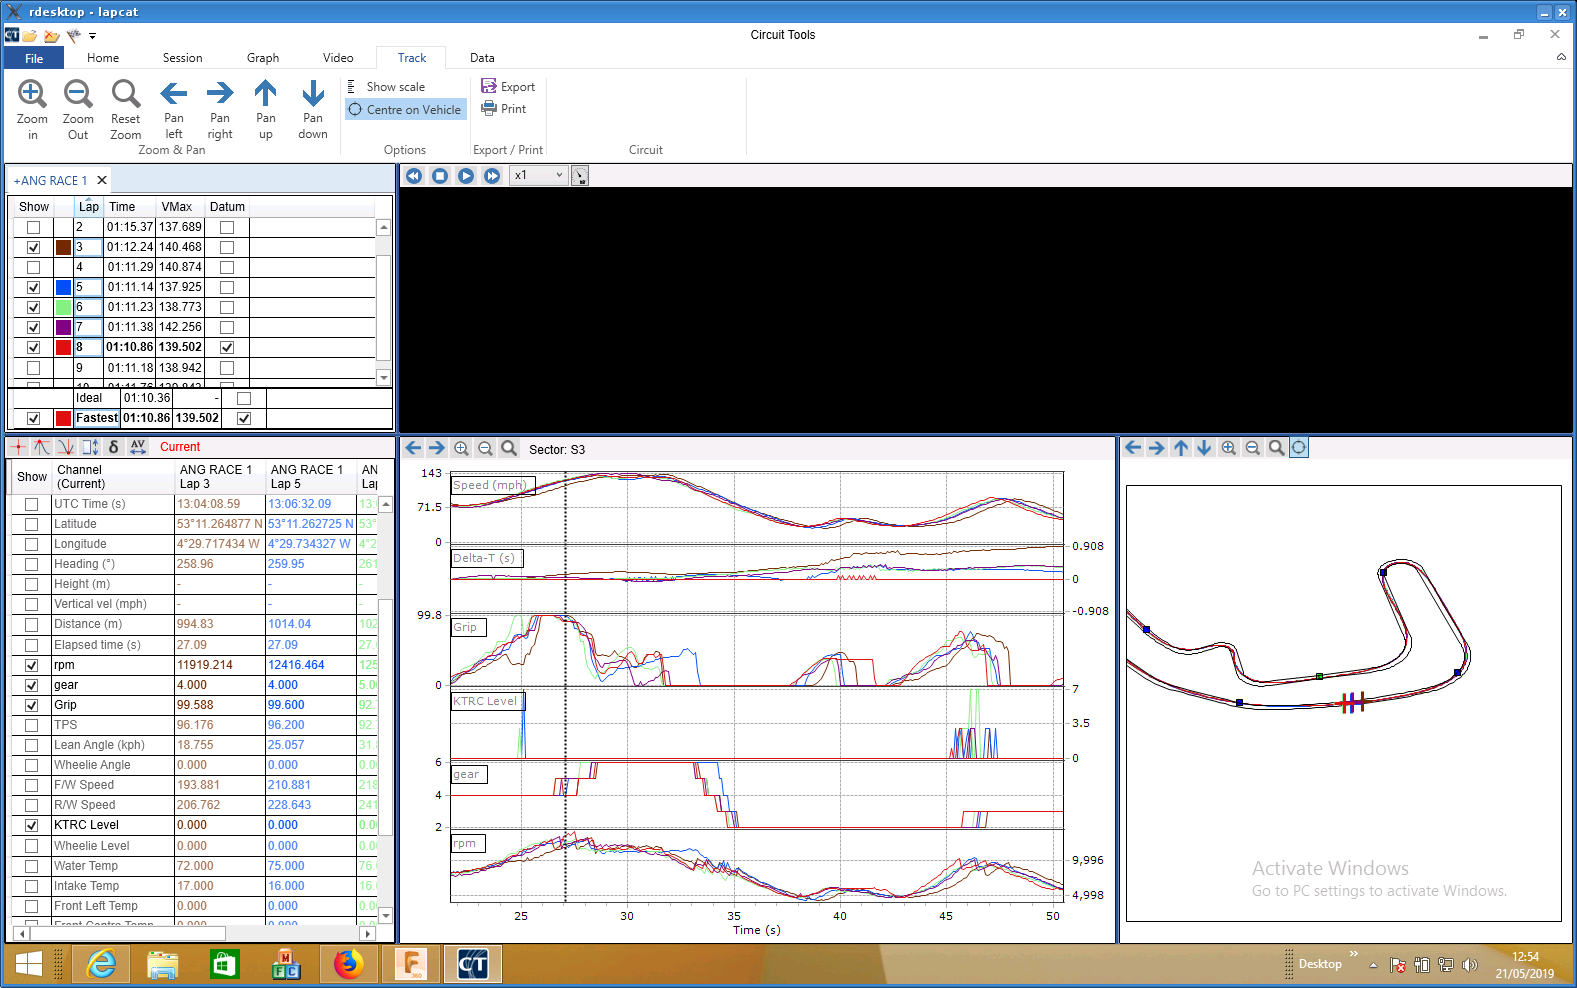
The above image is showing Real Data captured at the Anglesey No-Limits meeting.
Producing output for a different format wouldn't be that hard and it could easily be built into the Logger's firmware as a compile time option.